Ever wondered what whispers your computer leaves behind? System logs hold the secrets—silent records of every action, error, and event. Dive in to uncover their power.
What Are System Logs and Why Do They Matter?

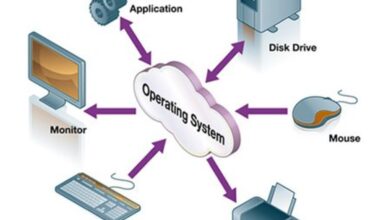
System logs are detailed records generated by operating systems, applications, and network devices that document events, activities, and changes occurring within a computing environment. These logs serve as a digital diary, capturing everything from user logins and file access to system errors and security breaches. Without them, troubleshooting would be like navigating a maze blindfolded.


The Core Definition of System Logs
At its most basic, a system log is a timestamped record of events stored in a structured or semi-structured format. These logs are generated automatically by system components such as the kernel, services, daemons, and applications. Each entry typically includes critical metadata: the timestamp, event severity level (like INFO, WARNING, ERROR), source component, and a descriptive message.
- Logs can be plain text files or binary formats depending on the system.
- They are often stored in standardized locations like
/var/logon Linux or the Windows Event Viewer on Windows systems. - Modern systems may use structured logging formats such as JSON or XML for easier parsing.
Understanding the anatomy of a log entry is essential. For example, a typical Linux syslog entry might look like this:
Jan 15 14:23:01 server sshd[1234]: Accepted password for admin from 192.168.1.100 port 54322 ssh2
This single line tells us when the event occurred, which service was involved (sshd), the nature of the event (successful login), and key details like the user, IP address, and protocol version. This level of detail makes system logs invaluable for both operational and forensic purposes.
Why System Logs Are Critical for IT Operations
System logs are not just technical footprints—they are strategic assets. In IT operations, they enable administrators to monitor system health, detect anomalies, and respond to incidents in real time. According to a SANS Institute report, over 70% of security investigations begin with log analysis.
- Logs help identify performance bottlenecks by revealing patterns in CPU usage, memory consumption, or disk I/O spikes.
- They support compliance with regulations like GDPR, HIPAA, and PCI-DSS, which require organizations to maintain audit trails.
- Automated monitoring tools like Nagios, Zabbix, or Prometheus rely heavily on system logs to trigger alerts.
Moreover, logs serve as a historical archive. When a system fails unexpectedly, engineers can rewind through the logs to pinpoint the root cause—whether it’s a failed update, a misconfigured firewall rule, or a rogue process consuming all available RAM.
The Evolution of System Logs Over Time
System logging has come a long way since the early days of computing. What began as simple printouts and punch cards has evolved into sophisticated, real-time data streams that power modern DevOps and cybersecurity practices.
From Paper Trails to Digital Records
In the 1960s and 70s, computer systems used physical printouts to record system events. Operators would review reams of paper to diagnose issues—an inefficient and error-prone process. With the advent of Unix in the 1970s, digital logging emerged. The introduction of the syslog protocol in 1980 by Eric Allman marked a turning point, enabling standardized message formatting and remote logging capabilities.
- Early syslog implementations were limited to local logging on single machines.
- The protocol was later extended to support network transmission, allowing logs to be centralized for easier management.
- Today, syslog remains a cornerstone of logging infrastructure, supported by nearly all Unix-like systems and many network devices.
The shift from paper to digital not only improved efficiency but also laid the foundation for automation and large-scale system monitoring.
Modern Logging: Cloud, Containers, and Real-Time Analytics
With the rise of cloud computing, microservices, and containerization (e.g., Docker, Kubernetes), traditional logging models have been challenged. Systems are now distributed, ephemeral, and highly dynamic, making centralized log management essential.
- Cloud platforms like AWS, Google Cloud, and Azure provide native logging services such as CloudWatch, Stackdriver, and Azure Monitor.
- Containerized environments generate logs at an unprecedented scale, requiring tools like Fluentd, Logstash, or Vector to collect and forward logs efficiently.
- Real-time log analytics platforms like Datadog, Splunk, and Elasticsearch enable instant querying, visualization, and alerting.
According to a 2023 State of Logging Report, 89% of organizations now use centralized logging solutions, up from just 45% a decade ago. This shift reflects the growing recognition that system logs are not just for debugging—they are strategic data assets.
Types of System Logs You Need to Know
Not all system logs are created equal. Different components of a computing environment generate distinct types of logs, each serving a unique purpose. Understanding these categories is crucial for effective system management and security monitoring.
Operating System Logs
These are the foundational logs generated by the OS kernel and core services. On Linux systems, they include messages from syslog, auth.log (for authentication events), and kern.log (for kernel-level messages). On Windows, the Event Viewer categorizes logs into Application, Security, and System logs.
- Linux: Found in
/var/log/, these logs track boot sequences, service startups, and hardware events. - Windows: The Security log records login attempts, privilege changes, and policy modifications—critical for auditing.
- macOS: Uses
Unified Logging Systemintroduced in macOS Sierra, which consolidates logs from apps, system services, and the kernel.
For example, a failed SSH login attempt on Linux appears in /var/log/auth.log like this:
Jan 15 14:20:03 server sshd[1230]: Failed password for invalid user admin from 192.168.1.101 port 54320 ssh2
This entry immediately flags a potential brute-force attack, especially if repeated across multiple timestamps.
Application Logs
Every software application—from web servers like Apache and Nginx to database systems like MySQL and PostgreSQL—generates its own logs. These logs capture application-specific events such as HTTP request details, query execution times, and error stack traces.
- Web server logs typically follow the Common Log Format (CLF) or Combined Log Format, recording IP addresses, request methods, URLs, response codes, and user agents.
- Database logs can include slow query logs, transaction logs, and error logs that help optimize performance.
- Custom applications often use logging frameworks like Log4j (Java), Winston (Node.js), or Python’s logging module to generate structured logs.
For instance, an Apache access log entry might look like:
192.168.1.100 – – [15/Jan/2025:14:25:01 +0000] “GET /index.html HTTP/1.1” 200 2326
This tells us a user requested the homepage and received a successful (200) response. A sudden spike in 500 errors in this log could indicate a backend failure.
Security and Audit Logs
These logs are specifically designed to track security-related events. They include authentication attempts, firewall rule triggers, intrusion detection alerts, and file integrity monitoring events.
- Tools like OSSEC, Wazuh, and auditd (Linux) generate detailed audit trails for compliance and threat detection.
- Security logs are often protected from tampering and require special permissions to access.
- They play a key role in meeting standards like ISO 27001, SOC 2, and NIST 800-53.
Audit logs can reveal insider threats—for example, a user accessing sensitive files outside of normal working hours. When correlated with other data sources, they form the backbone of a robust Security Information and Event Management (SIEM) system.
How System Logs Enhance Security Monitoring
In today’s threat landscape, system logs are one of the most powerful tools for detecting and responding to cyberattacks. They provide the visibility needed to identify malicious activity before it escalates into a full-blown breach.
Detecting Unauthorized Access Attempts
One of the most common uses of system logs in security is identifying unauthorized access. Failed login attempts, repeated password guesses, or logins from unusual geographic locations are all red flags visible in authentication logs.
- On Linux, monitoring
/var/log/auth.logor/var/log/securecan reveal SSH brute-force attacks. - Windows Security logs record Event ID 4625 for failed logins and 4624 for successful ones—key indicators for account compromise.
- Automated tools like Fail2Ban analyze these logs in real time and block offending IPs after a threshold is reached.
For example, seeing dozens of failed SSH attempts from a single IP within minutes is a classic sign of a botnet attack. Without system logs, such patterns would go unnoticed until damage was done.
Identifying Malware and Intrusion Signatures
Malware often leaves traces in system logs—unusual process executions, unexpected network connections, or changes to system files. Antivirus and endpoint detection tools log these events, but so do the operating system and firewall.
- A sudden appearance of
svchost.execonnecting to an external IP on a non-standard port may indicate a reverse shell. - Firewall logs showing outbound traffic to known command-and-control (C2) servers are strong indicators of compromise.
- File integrity monitoring tools like AIDE or Tripwire log changes to critical system binaries—helping detect rootkits.
According to a CISA guideline, maintaining comprehensive system logs is a foundational practice for intrusion detection and incident response.
Supporting Forensic Investigations
After a security incident, system logs become the primary source of evidence. They allow investigators to reconstruct the attack timeline, identify entry points, and determine the scope of data exposure.
- Logs can show when an attacker first gained access, which accounts were used, and what systems were compromised.
- They help distinguish between automated scans and targeted attacks based on behavior patterns.
- Proper log retention policies ensure data is available when needed—typically 90 days minimum, longer for regulated industries.
For example, during a ransomware investigation, logs might reveal that an employee clicked a phishing link, leading to a PowerShell download from a malicious domain. This chain of events, captured in browser history, firewall logs, and process execution logs, forms the basis of the forensic report.
Best Practices for Managing System Logs
Collecting logs is only the first step. To derive real value, organizations must implement best practices for log management, including centralization, retention, and protection.
Centralize Logs for Better Visibility
Decentralized logs are hard to monitor and analyze. Centralizing logs into a single platform enables unified search, correlation, and alerting across all systems.
- Use log aggregation tools like Fluentd, Logstash, or Vector to collect logs from servers, containers, and cloud services.
- Forward logs to a centralized repository such as Elasticsearch, Splunk, or a SIEM platform.
- Ensure logs are timestamped consistently using UTC to avoid timezone confusion during analysis.
Centralization also simplifies compliance reporting. Instead of manually collecting logs from dozens of servers, administrators can generate reports from a single dashboard.
Implement Proper Log Retention Policies
How long should you keep system logs? The answer depends on regulatory requirements, business needs, and storage capacity.
- GDPR and HIPAA recommend retaining logs for at least one year for audit purposes.
- PCI-DSS requires 90 days of log retention for systems handling cardholder data.
- Many organizations adopt tiered retention: 30 days of hot storage (for fast access), 90 days of warm storage, and archival beyond that.
Automated log rotation tools like logrotate on Linux help manage file sizes and prevent disk exhaustion. Without rotation, logs can grow uncontrollably and crash systems.
Secure Logs Against Tampering
If logs can be altered or deleted, their integrity is compromised. Attackers often erase logs to cover their tracks—a technique known as log wiping.
- Store logs on write-once, read-many (WORM) storage or immutable storage solutions.
- Use cryptographic hashing to detect tampering—tools like OSSEC can verify log integrity.
- Restrict access to log files using role-based access control (RBAC) and audit access attempts.
- Send copies of logs to a remote, secure server in real time to prevent local deletion.
As emphasized by the NIST Special Publication 800-92, log integrity is as important as log collection itself.
Tools and Technologies for Analyzing System Logs
With the volume of data generated by modern systems, manual log analysis is no longer feasible. A range of tools have emerged to automate collection, parsing, and insight generation from system logs.
Open Source Logging Solutions
For organizations seeking cost-effective and customizable options, open-source tools offer powerful capabilities.
- ELK Stack (Elasticsearch, Logstash, Kibana): A popular trio for log ingestion, storage, and visualization. Logstash parses logs, Elasticsearch indexes them, and Kibana provides dashboards.
- Graylog: Offers a user-friendly interface with alerting, extraction, and correlation features. Supports syslog, GELF, and custom inputs.
- Fluentd: A data collector that unifies log forwarding, supporting over 500 plugins for sources and destinations.
These tools are widely used in DevOps environments and can be deployed on-premises or in the cloud.
Commercial Log Management Platforms
Enterprises with complex environments often turn to commercial solutions that offer scalability, support, and advanced analytics.
- Splunk: One of the most powerful log analysis platforms, capable of processing petabytes of data. Offers machine learning for anomaly detection.
- Datadog: Combines log management with metrics and APM (Application Performance Monitoring) in a unified platform.
- Sumo Logic: Cloud-native platform with real-time analytics and compliance-ready templates.
While these tools come with licensing costs, they reduce operational overhead and provide enterprise-grade reliability.
SIEM Systems: The Ultimate Log Powerhouse
Security Information and Event Management (SIEM) systems go beyond basic log aggregation. They correlate events across multiple sources, apply threat intelligence, and generate actionable alerts.
- Examples include IBM QRadar, Microsoft Sentinel, and Palo Alto Cortex XDR.
- SIEMs use rules and machine learning to detect complex attack patterns, such as lateral movement or data exfiltration.
- They integrate with firewalls, endpoints, and cloud services to provide a holistic security view.
According to Gartner, SIEM adoption grew by 18% in 2024, driven by increasing cyber threats and regulatory demands.
Common Challenges in System Log Management
Despite their importance, managing system logs effectively is fraught with challenges. From data overload to misconfigurations, organizations often struggle to get the most out of their logging infrastructure.
Log Volume and Noise
Modern systems generate terabytes of logs daily. Sifting through this data to find relevant events is like finding a needle in a haystack.
- Many logs are low-severity (INFO or DEBUG) and add noise without value.
- Without proper filtering, alert fatigue sets in, causing real threats to be ignored.
- Solutions include log sampling, intelligent filtering, and using AI to prioritize high-risk events.
For example, a single Kubernetes cluster can generate millions of log entries per day. Tools like Loki (by Grafana) are designed to handle high-volume, low-latency log queries efficiently.
Log Format Inconsistency
Logs come in various formats—plain text, JSON, CSV—making parsing and analysis difficult. Even within the same system, different applications may use different logging standards.
- Unstructured logs require custom parsers to extract meaningful fields.
- Adopting structured logging (e.g., JSON logs) improves consistency and machine readability.
- Tools like Logstash and Fluent Bit support grok patterns to parse unstructured logs.
Standardizing log formats across teams and applications is a key step toward effective log management.
Performance Impact of Logging
Excessive logging can degrade system performance. Writing logs to disk consumes I/O resources, and network logging can introduce latency.
- High-frequency logging in production environments should be avoided unless necessary.
- Use asynchronous logging to prevent blocking application threads.
- Adjust log levels dynamically—e.g., switch from DEBUG to INFO in production.
As noted in the AWS Logging Best Practices, logging should be optimized to balance visibility and performance.
Future Trends in System Logs and Log Analytics
The world of system logs is evolving rapidly. Emerging technologies are reshaping how logs are generated, processed, and used for decision-making.
AI and Machine Learning in Log Analysis
Artificial intelligence is transforming log analytics by enabling anomaly detection, predictive maintenance, and automated root cause analysis.
- ML models can learn normal behavior and flag deviations—like a sudden spike in error rates.
- Tools like Splunk IT Service Intelligence (ITSI) use ML to predict outages before they occur.
- AI-powered chatbots can query logs and provide natural language summaries of incidents.
A 2024 McKinsey report found that AI-driven log analysis reduced mean time to detect (MTTD) incidents by 65% in pilot organizations.
Edge Computing and Decentralized Logging
As computing moves to the edge—IoT devices, autonomous vehicles, remote sensors—centralized logging faces new challenges. Bandwidth limitations and latency require new approaches.
- Edge devices may perform local log filtering and only transmit critical events.
- Federated logging architectures allow partial analysis at the edge and aggregation in the cloud.
- Blockchain-based logging is being explored for tamper-proof audit trails in distributed systems.
These trends demand lightweight, efficient logging protocols and intelligent data reduction techniques.
The Rise of Observability Platforms
Logging is no longer standalone. It’s part of a broader trend toward observability—combining logs, metrics, and traces (telemetry data) for full system visibility.
- Modern observability platforms like Grafana, New Relic, and Honeycomb provide unified interfaces for all data types.
- OpenTelemetry is emerging as a vendor-neutral standard for collecting and exporting telemetry data.
- Observability enables faster debugging, better performance tuning, and improved user experience.
As systems grow more complex, the ability to correlate a log entry with a slow API call and a database query becomes essential.
What are system logs used for?
System logs are used for monitoring system health, diagnosing errors, detecting security threats, ensuring compliance, and supporting forensic investigations. They provide a detailed record of events that help IT teams maintain and secure computing environments.
Where are system logs stored on Linux?
On Linux, system logs are typically stored in the /var/log directory. Key files include syslog, auth.log, kern.log, and messages. The exact location and naming may vary by distribution and logging daemon (e.g., rsyslog, syslog-ng).
How can I view system logs on Windows?
On Windows, use the Event Viewer application to view system logs. Press Win + R, type eventvwr.msc, and press Enter. Logs are categorized under Windows Logs (Application, Security, System) and can be filtered, searched, and exported.
Are system logs secure by default?
No, system logs are not always secure by default. They can be vulnerable to tampering or unauthorized access. Best practices include centralizing logs, restricting permissions, enabling integrity checks, and sending logs to immutable storage.
What is the best tool for analyzing system logs?
The best tool depends on your needs. For open-source solutions, ELK Stack or Graylog are excellent. For enterprise environments, Splunk or Datadog offer advanced features. SIEM platforms like Microsoft Sentinel provide deep security analytics.
System logs are far more than technical artifacts—they are the heartbeat of modern IT infrastructure. From troubleshooting everyday glitches to uncovering sophisticated cyberattacks, they provide the visibility and accountability that organizations need to thrive in a digital world. As technology evolves, so too will the ways we collect, analyze, and act on log data. Embracing best practices, leveraging powerful tools, and staying ahead of emerging trends will ensure that system logs remain a cornerstone of operational excellence and security resilience.
Further Reading: